How Fast Does Your Website Load? GTmetrix Knows.
by Jason Unger, Founder
Insights / Website Design /

Photo by Kelly Lacy via Pexels
Your website’s loading time matters.
Instinctively, we all know this.
But it’s easy to make excuses for why we need that extra chunk of code, or why this plugin has to be installed, or why we didn’t optimize a given image.
All of these have an impact on how quickly your website loads, which has a direct correlation to your user experience – which directly relates to the performance of your business or organization. On top of that, with Google’s recent updates that heavily focus on Core Web Vitals, speed and load time are increasingly important factors for SEO.
You Have 10 Seconds. That’s It.
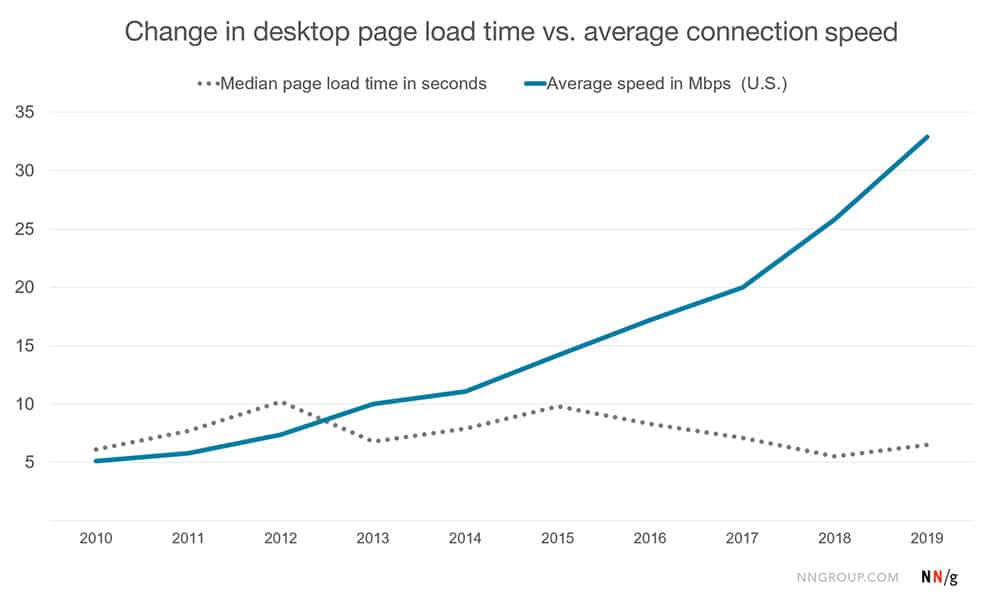
Our gurus at the Nielsen Norman Group have been tracking loading time for years, and despite the fact that Internet speeds have continued to increase, websites aren’t any faster.
Take a look at this graph, from “The Need for Speed, 23 Years Later“.
Rather than loading faster thanks to a faster connection, most websites load at about the same speed as they did in 2010.
So what’s the cutoff time for losing a user?
10 seconds.
If your website visitor has to wait 10 seconds, they’re gone.
Remember, you never have your users’ undivided attention; they are always at risk of opening a new tab, switching to a different app, or simply closing the browser and doing something else.
Improving your website speed matters.
How to Check Your Website Load Time
Our favorite tool for checking how long our websites load is GTmetrix.
It’s free, it’s fast, and it’s comprehensive.
Essentially, GTmetrix loads your website and grades its performance, including:
- how quickly the first bit of content loads on the site (“First Contentful Paint”)
- how much loading time is being blocked by scripts (“Total Blocking Time”)
- how quickly the “above the fold” content completely appears to a visitor (“Speed Index”)
These are some of the most important items to measure, and can literally make a difference in how well your website – and therefore, your business – performs.
GTmetrix will also provide a “waterfall” chart, which shows the loading order and time of every element on your site.
Compare Your Load Time to Your Competitors
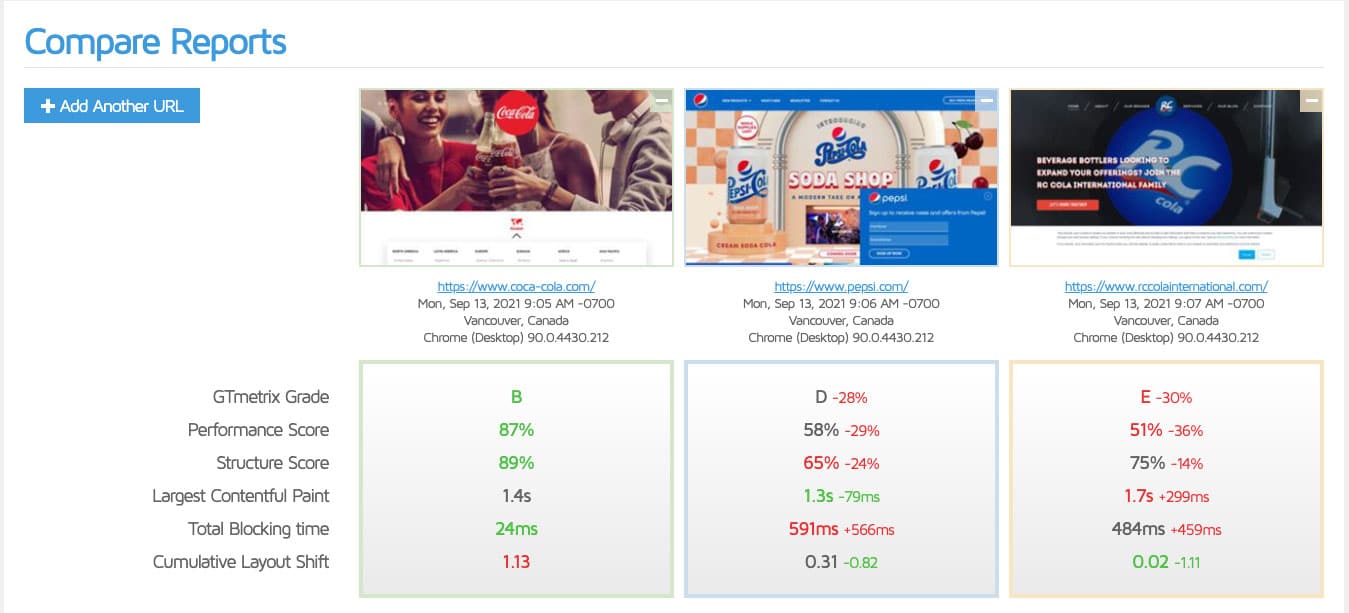
In addition to seeing how well your site performs, you can easily compare your load time to your competitors using the “Compare” feature.
It can be pretty eye-opening to see that your competitors are out-performing you; so, what can you do about it?
Thankfully, GTmetrix identifies the “Top Issues” affecting your site performance and how big of an impact they’re having on performance.
Those issues can include:
- improperly sized images
- excessive CSS and Javascript execution time
- lengthy server response time
Most of the issues can be easily solved with a performance audit and/or the implementation of website caching. (Not sure how to do that? Reach out and we’ll help.)
One of the really cool things GTmetrix can do is show you a video of your website loading, so you can see the elements as they appear and identify any issues that may cause Core Web Vital results (like Cumulative Layout Shift) to be less than stellar. The recorded video can be watched in real-time, or slowed down to 1/2 or 1/4 speed – exactly what you need when trying to pinpoint specific problems.
While there are other website performance tools, like Google’s web.dev, GTmetrix is the most reliable with the best advice on how to optimize your website for speed.
Ready to check out your website loading time? Click here for GTmetrix.


